Andy Jiménez
Financial Data Scientist
Bachelor's Degree in Finance.
Programming projects in Finance fields such as Financial Modelling, Stock Prediction, Portfolio Optimization, Valuation, Forecasting Time-series, etc.
View My LinkedIn Profile
Home
What is the average price of printed books and eBooks in Colombian Market?
Click Here to see Code
Project description: The goal of this project is to calculate the average price of new printed books and ebooks in Colombia. To do so, it takes as reference one of the best library online in Colombia - Libreria de la U- to scrape thousends of book items.
Scraping Date: March 2020
1. Load scraped data into json formatting
To scrape the book items, we need to load the data into a json format and iterate over it. This website doesn’t have pagination.
try:
            data = json.loads(response.text)

            if len(data)==0:
                pass

            else:
                for i in data:
                    try: autor.append(i['Autor'][0])
                    except Exception: autor.append(None)

                    try: editorial.append(i['Editorial'][0])
                    except Exception: editorial.append(None)

                   ...
2. Loading data in Pandas
Load data into a structured table
f = pd.DataFrame(data=[autor,editorial,edicion,pag,ISBN,tipo,formato,titulo,categoria,precio,file,size,peso,tamano,acabado,link], index=None)
df=f.transpose()
df.columns=['Autor','Editorial','Edicion','Paginas','ISBN','Tipo','Formato','Titulo','Categoria','Precio','File','Size-MB','Peso','Tamaño','Acabado','Link']
3. Data Analysis
With the price of the books, we can plot a distribution price and plot the price of books by category:
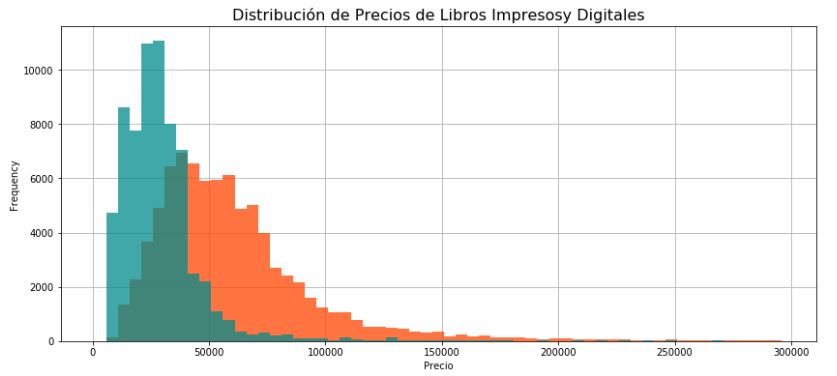
df[impreso].Precio.describe()
| count | 82403.000000 |
| mean | 60440.518901 |
| std | 35019.842480 |
| min | 10100.000000 |
| 25% | 37200.000000 |
| 50% | 53300.000000 |
| 75% | 73000.000000 |
| max | 299900.000000 |
df[ebook].Precio.describe()
| count | 67213.000000 |
| mean | 29784.759258 |
| std | 20493.653868 |
| min | 10100.000000 |
| 25% | 17900.000000 |
| 50% | 26800.000000 |
| 75% | 35300.000000 |
| max | 299900.000000 |
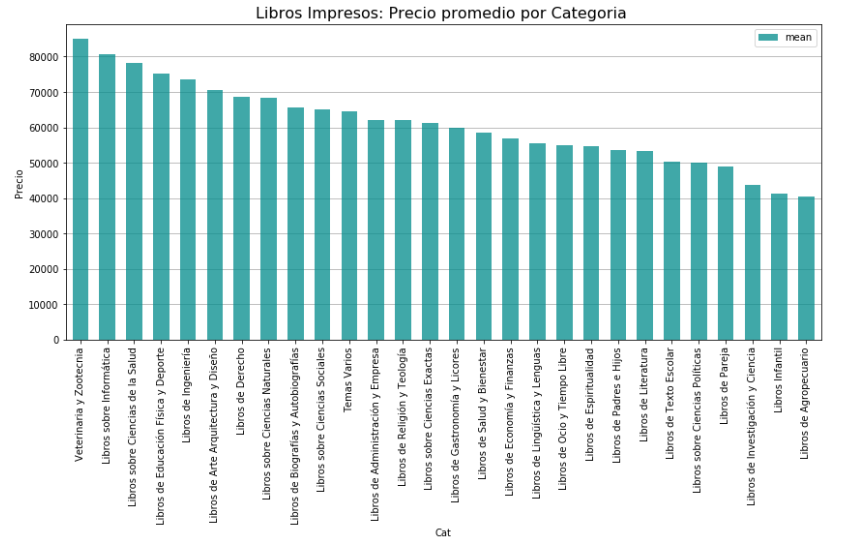
Price of Books by Category: